Core Web Vitals have moved from a Google ranking signal experiment to a foundational pillar of modern technical SEO. For B2B companies running complex WordPress, Webflow, or Shopify sites, ignoring these metrics means leaving measurable revenue on the table. Google's own research shows that sites meeting Core Web Vitals thresholds are 24% less likely to be abandoned before a page fully loads — a statistic that translates directly into lead capture rates and demo request conversions.
This post breaks down the advanced strategies development teams and marketing directors need to implement to not just pass Core Web Vitals audits, but to build architectures that sustain those scores over time.
Understanding Core Web Vitals Beyond the Basics
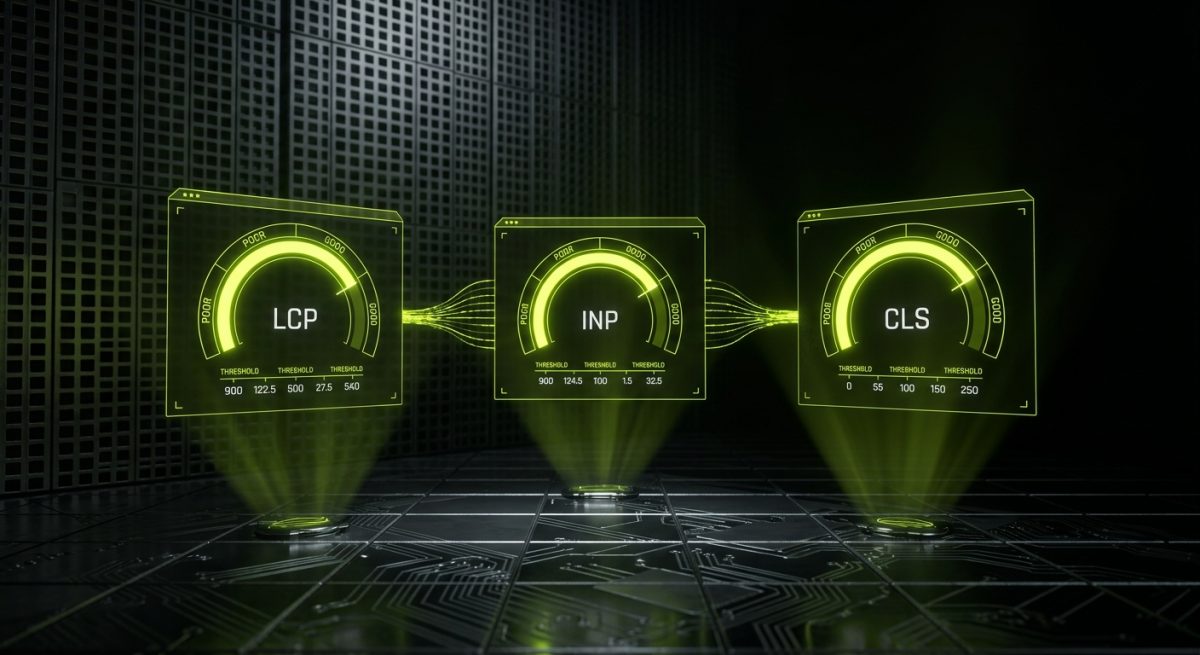
Most development teams are familiar with the three primary metrics: Largest Contentful Paint (LCP), Interaction to Next Paint (INP) — which replaced First Input Delay in March 2024 — and Cumulative Layout Shift (CLS). But understanding what these metrics actually measure at a technical level is what separates teams that achieve consistent green scores from those stuck in a perpetual cycle of auditing and patching.
LCP: What Google Is Actually Measuring
LCP measures the render time of the largest image or text block visible within the viewport. The threshold for a "Good" score is under 2.5 seconds. What many implementations miss is that LCP is measured from the perspective of real users via Chrome User Experience Report (CrUX) data, not just lab environments like Lighthouse.
Common LCP elements on B2B sites include:
- Hero images or above-the-fold banner graphics
- Large H1 headings rendered via custom web fonts
- Video poster frames
- CSS background images (which are handled differently than
<img>tags)
A critical technical nuance: CSS background images are not eligible for LCP measurement in the same way as <img> elements. This means that hero sections built purely with CSS backgrounds may report artificially optimistic LCP scores in lab tools but still perform poorly for real users depending on how the browser prioritizes resource loading.
INP: The Metric Most Teams Underestimate
Interaction to Next Paint replaced FID because FID only measured the delay before the browser could start processing an event — not how long that processing actually took. INP captures the full latency of any interaction throughout the page lifecycle, from click to visual response.
For B2B sites with complex JavaScript-driven interfaces — think multi-step forms, dynamic pricing calculators, or interactive product configurators — INP is often the hardest metric to optimize. The "Good" threshold is under 200 milliseconds.
Key contributors to poor INP scores:
- Long Tasks on the main thread: Any JavaScript task exceeding 50ms blocks the browser from responding to user input
- Third-party scripts: Tag managers, chat widgets, analytics libraries, and marketing pixels are frequent offenders
- Unoptimized React or Vue component trees: Excessive re-renders triggered by state changes can spike INP dramatically
CLS: Layout Stability in Dynamic Environments
Cumulative Layout Shift measures unexpected layout movement. The "Good" threshold is a score under 0.1. On B2B sites, the most common CLS sources are:
- Images and embeds without explicit
widthandheightattributes - Dynamically injected content (banners, cookie notices, chat widgets) that push existing content down
- Web fonts causing Flash of Unstyled Text (FOUT) that shifts surrounding elements
- Ad slots or dynamic content blocks that load asynchronously
The technical fix for font-related CLS involves using font-display: optional or font-display: swap combined with preloading critical fonts:
<link rel="preload" href="/fonts/inter-var.woff2" as="font" type="font/woff2" crossorigin>For images, always declare dimensions explicitly or use CSS aspect-ratio containers to reserve space before the image loads.
Advanced Implementation Strategies for LCP Optimization
Achieving a sub-2.5 second LCP on a content-rich B2B site requires a multi-layered approach that spans server infrastructure, asset delivery, and rendering strategy. There is no single plugin or setting that solves this — it requires deliberate architectural decisions.
Prioritizing the LCP Resource
The most impactful change most B2B sites can make is adding fetchpriority="high" to the LCP image element. This browser hint tells the preload scanner to prioritize this resource above others:
<img
  src="/images/hero-dashboard.webp"
  alt="B2B Analytics Dashboard"
  width="1200"
  height="630"
  fetchpriority="high"
  loading="eager"
/>
Note that loading="lazy" should never be applied to the LCP element. This is a common misconfiguration introduced by WordPress optimization plugins that apply lazy loading globally without exempting above-the-fold images.
Server Response Time and TTFB
LCP cannot be fast if Time to First Byte (TTFB) is slow. Google considers TTFB under 800ms as "Good." For WordPress sites, the primary levers are:
- Full-page caching: Tools like WP Rocket, LiteSpeed Cache, or server-level Nginx FastCGI caching eliminate PHP processing time for cached pages
- Database query optimization: Use Query Monitor to identify slow queries. N+1 query problems from poorly coded plugins are a frequent culprit
- CDN with edge caching: Cloudflare, Fastly, or AWS CloudFront can serve cached HTML from edge nodes geographically close to users, reducing network latency significantly
- Hosting infrastructure: Shared hosting environments impose CPU and memory constraints that make consistent TTFB targets impossible. Managed WordPress hosting on dedicated container infrastructure (Kinsta, WP Engine, Cloudways) is a prerequisite for enterprise performance
Image Delivery Architecture
Modern image optimization goes beyond compression. A production-grade image delivery strategy includes:
- Next-gen formats: Serve WebP with AVIF as a progressive enhancement. AVIF offers 50% smaller file sizes than WebP at equivalent quality
- Responsive images: Use
srcsetandsizesattributes to serve appropriately sized images per viewport - Image CDNs: Services like Cloudinary, Imgix, or Bunny.net provide on-the-fly format conversion, resizing, and delivery optimization without manual export workflows
<img
  src="/images/hero.webp"
  srcset="/images/hero-480.webp 480w, /images/hero-800.webp 800w, /images/hero-1200.webp 1200w"
  sizes="(max-width: 600px) 480px, (max-width: 900px) 800px, 1200px"
  alt="Platform overview"
  width="1200"
  height="630"
  fetchpriority="high"
/>
Critical CSS and Render-Blocking Resources
Render-blocking CSS delays LCP by preventing the browser from painting until stylesheets are fully downloaded and parsed. The solution is inlining critical (above-the-fold) CSS directly in the <head> and deferring non-critical styles:
<style>
  /* Inlined critical CSS */
  .hero { background: #0a0a0a; padding: 80px 0; }
  .hero h1 { font-size: clamp(2rem, 5vw, 4rem); color: #fff; }
</style>
<link rel="preload" href="/css/main.css" as="style" onload="this.onload=null;this.rel='stylesheet'">
<noscript><link rel="stylesheet" href="/css/main.css"></noscript>
Tools like Critical (npm package) or PurgeCSS can automate the extraction of above-the-fold styles. On WordPress, WP Rocket's "Optimize CSS Delivery" feature handles this automatically, though manual verification is always recommended for complex themes.
Diagnosing and Fixing INP at Scale
INP optimization is fundamentally a JavaScript performance problem. Unlike LCP, which is largely an asset delivery challenge, INP requires profiling real interaction patterns and restructuring how JavaScript executes on the main thread.
Profiling with Chrome DevTools
The Performance panel in Chrome DevTools is the primary tool for diagnosing INP issues. The workflow:
- Open DevTools → Performance tab
- Enable "Web Vitals" checkbox in the toolbar
- Start recording, perform the interaction that feels slow (form submission, dropdown open, filter click)
- Stop recording and examine the flame chart for Long Tasks (shown in red)
- Identify the call stack responsible for the long task
The Interaction to Next Paint section in the Performance Insights panel (available in Chrome 104+) provides a direct breakdown of input delay, processing time, and presentation delay for each interaction.
Breaking Up Long Tasks
The primary technique for reducing INP is decomposing long synchronous JavaScript tasks into smaller chunks that yield control back to the browser. The scheduler.yield() API (available in Chrome 115+) provides a clean mechanism:
async function processFormSubmission(formData) {
  // First chunk: validate
  validateFormData(formData);

  // Yield to browser — allows pending user interactions to be processed
  await scheduler.yield();

  // Second chunk: transform
  const payload = transformData(formData);

  await scheduler.yield();

  // Third chunk: submit
  await submitToAPI(payload);
}
For environments where scheduler.yield() is not yet available, setTimeout(fn, 0) provides a fallback, though with less precision.
Third-Party Script Management
Third-party scripts are responsible for a disproportionate share of INP regressions on B2B sites. A structured approach to third-party script governance:
- Audit all third-party scripts using the Coverage tab in DevTools and WebPageTest's waterfall view
- Load non-critical scripts after user interaction: Chat widgets, heatmap tools, and secondary analytics can be deferred until the user first scrolls or clicks
- Use Partytown for scripts that can run in a Web Worker instead of the main thread — particularly useful for Google Tag Manager and analytics libraries
- Establish a performance budget: Define a maximum JavaScript payload (e.g., 300KB compressed) and enforce it in CI/CD pipelines using tools like bundlesize or Lighthouse CI
// Defer chat widget until first user interaction
const loadChatWidget = () => {
  const script = document.createElement('script');
  script.src = 'https://chat-provider.com/widget.js';
  document.head.appendChild(script);
  ['click', 'scroll', 'keydown'].forEach(event =>
    document.removeEventListener(event, loadChatWidget)
  );
};

['click', 'scroll', 'keydown'].forEach(event =>
  document.addEventListener(event, loadChatWidget, { once: true })
);
React and Framework-Specific Optimizations
For B2B applications built on React (common in headless WordPress or custom Webflow extensions), INP issues often stem from synchronous state updates triggering expensive re-renders. React 18's startTransition API marks non-urgent state updates as interruptible:
import { startTransition } from 'react';

function FilterPanel({ onFilterChange }) {
  const handleChange = (value) => {
    // Urgent: update input immediately
    setInputValue(value);

    // Non-urgent: defer expensive list re-render
    startTransition(() => {
      onFilterChange(value);
    });
  };
}
Additionally, React.memo, useMemo, and useCallback should be applied judiciously to prevent unnecessary re-renders in component trees that are triggered by user interactions.
Monitoring Core Web Vitals in Production
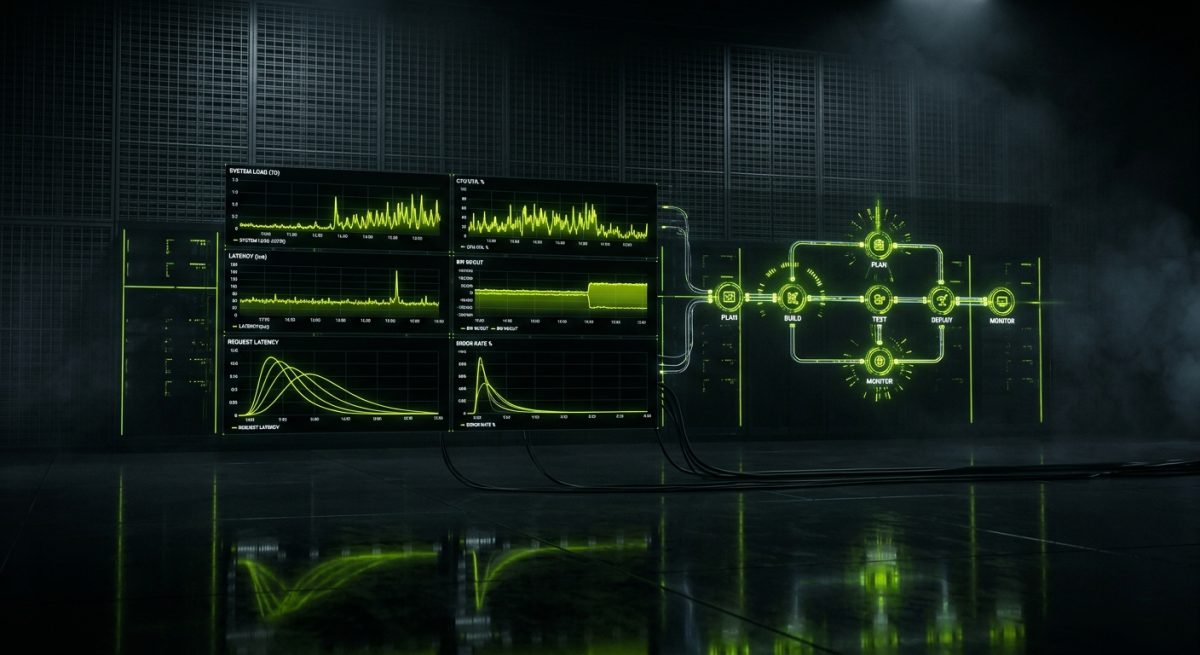
Laboratory tools like Lighthouse and PageSpeed Insights provide useful directional data, but they do not reflect real user experience. Google uses field data from the Chrome User Experience Report (CrUX) for ranking purposes — which means production monitoring is non-negotiable for any serious technical SEO program.
Setting Up Real User Monitoring (RUM)
The web-vitals JavaScript library from Google provides accurate, production-grade metric collection with minimal overhead:
import { onCLS, onINP, onLCP, onFCP, onTTFB } from 'web-vitals';

function sendToAnalytics(metric) {
  const body = JSON.stringify({
    name: metric.name,
    value: metric.value,
    rating: metric.rating, // 'good', 'needs-improvement', 'poor'
    delta: metric.delta,
    navigationType: metric.navigationType,
    url: window.location.href,
  });

  navigator.sendBeacon('/analytics/vitals', body);
}

onCLS(sendToAnalytics);
onINP(sendToAnalytics);
onLCP(sendToAnalytics);
onFCP(sendToAnalytics);
onTTFB(sendToAnalytics);
This data can be piped into any analytics backend — BigQuery, Datadog, Grafana, or custom dashboards — enabling percentile-based analysis (p75 is what Google uses for CrUX scoring) rather than relying on single-sample lab results.
Google Search Console Core Web Vitals Report
Google Search Console's Core Web Vitals report aggregates CrUX data at the URL group level and categorizes pages as Good, Needs Improvement, or Poor. Key workflows for B2B teams:
- Segment by URL pattern: Identify whether performance issues are concentrated on specific page templates (e.g., all blog posts, all product pages, landing pages)
- Monitor after deployments: Track metric changes following major site updates. A regression in LCP or INP after a plugin update or theme change will appear in CrUX data within 28 days
- Prioritize high-traffic, high-conversion pages: Not all pages need to be optimized equally. Focus engineering effort on pages with the highest business impact first
Lighthouse CI in Development Pipelines
Preventing performance regressions before they reach production is more cost-effective than remediating them after the fact. Lighthouse CI integrates with GitHub Actions, GitLab CI, and other pipeline tools:
# .github/workflows/lighthouse.yml
name: Lighthouse CI
on: [pull_request]
jobs:
  lighthouse:
    runs-on: ubuntu-latest
    steps:
      - uses: actions/checkout@v3
      - name: Run Lighthouse CI
        uses: treosh/lighthouse-ci-action@v10
        with:
          urls: |
            https://staging.yoursite.com/
            https://staging.yoursite.com/services/
          budgetPath: ./lighthouse-budget.json
          uploadArtifacts: true
Define performance budgets in lighthouse-budget.json to fail builds that regress LCP, INP, or CLS beyond acceptable thresholds. This creates a cultural shift from reactive performance fixes to proactive performance governance.
CrUX API for Competitive Benchmarking
The Chrome UX Report API provides programmatic access to field data for any URL with sufficient traffic. B2B agencies can use this to benchmark client sites against competitors:
curl -X POST \
  'https://chromeuxreport.googleapis.com/v1/records:queryRecord?key=YOUR_API_KEY' \
  -H 'Content-Type: application/json' \
  -d '{
    "url": "https://competitor.com/",
    "metrics": ["largest_contentful_paint", "interaction_to_next_paint", "cumulative_layout_shift"]
  }'
This data enables objective, data-driven conversations with clients about where their site stands relative to industry peers — a powerful input for prioritizing technical SEO investments. Sites in the top quartile of Core Web Vitals performance within their category consistently demonstrate lower bounce rates, higher session durations, and stronger conversion rates, making the business case for ongoing performance investment straightforward to quantify.